The 2024-25 NBA playoffs are now in full swing, marking the start of the two-month quest for the championship. While every team reaching this stage possesses inherent strengths, the postseason format is also designed to highlight roster deficiencies. Each playoff-bound squad carries statistical vulnerabilities—some more critical than others—that could potentially derail a deep playoff run.
To identify these potential pitfalls, I analyzed each team`s performance relative to the league average across key regular-season metrics. These included factors like game pace, shooting volume and efficiency from different areas, turnover rates, the impact of star players, and playoff experience. My research focused on categories that have shown the strongest correlation with reaching the NBA Finals in the modern era (since 2012-13, a period characterized by the significant rise of 3-point shooting). I then applied these findings to the current playoff field, pinpointing teams whose primary weaknesses are amplified by their importance in playoff competition.
The result is a categorization of teams based on how significantly their worst statistical trait might impede their championship aspirations.
Big Problems?
These four teams exhibit significant deficiencies in statistically important areas – issues that could severely hinder a deep playoff run.

Orlando Magic
Stat category: 3-point percentage (31.8%, 30th)
Why it matters: A team`s accuracy from beyond the arc is a crucial predictor of making the Finals in today`s NBA. This regular season, teams collectively hit a league-record 42.2% from deep, with over 40% of all shots coming from outside the arc. This trend leaves teams like the Magic, who ranked 18th in 3-point attempt frequency and dead last in conversion rate (31.8%), somewhat detached from the dominant trends in successful basketball. Neither of their leading scorers, Paolo Banchero nor Franz Wagner, possess strong outside games (both were significantly below average from three), and even their most frequent deep shooters in the regular season rotation, Kentavious Caldwell-Pope and Tristan Da Silva, shot below the league average from distance. Notably, none of Orlando`s top 10 players in terms of minutes played exceeded the league average in 3-point percentage.
Saving grace? Opponent block rate (8.7%, 10th)… The Magic are effective at finishing at the rim, which is a valuable asset in the playoffs against teams with skilled shot-blocking bigs.

Houston Rockets
Stat category: 2-point percentage (51.8%, 27th)
Why it matters: While 3-point shooting is vital, data from the past decade suggests that making shots inside the arc can be equally, if not more, predictive of reaching the Finals. This presents a challenge for the Rockets, who weren`t strong shooters overall. They were below average in both 3-point accuracy and frequency and finished the regular season among the NBA`s worst 2-point shooting teams. Three of their top five scorers (Jalen Green, Fred VanVleet, and Dillon Brooks) shot 48% or worse on two-pointers. While their league-leading offensive rebounding rate helps mitigate some of this, teams that heavily rely on offensive boards haven`t historically fared well in reaching the Finals recently.
Saving grace? WAR of best player (Amen Thompson at 8.8, 8th)… This metric highlights the disproportionate influence of star players in the postseason. Although Thompson doesn`t have the high usage rate of other top stars, he stands out as one of the most effective two-way players among the playoff contenders.

Denver Nuggets
Stat category: 3-point attempt rate (35.6% of FGA, 30th)
Why it matters: Unlike Orlando, the Nuggets are good 3-point shooters, converting at 37.6% (fifth best in the regular season). However, their offense, primarily built under former coach Michael Malone, historically prioritized shots closer to the basket or getting to the free throw line. This strategy isn`t inherently bad, especially with many actions involving Nikola Jokić. Yet, only one of their top seven minute-earners (Michael Porter Jr.) took threes more frequently than the league average, making the deep shot more of an option than a central focus. Recent playoff history indicates that contenders need a consistent volume of 3-point attempts in their shot selection, with teams above average in this rate tending to advance further, even when controlling for their accuracy. The trend didn`t shift significantly under new coach David Adelman, as their 3-point attempt rate in the final three regular-season games (32.8%) was lower than Malone`s season average (35.7%).
Saving grace? WAR of their best player (Jokić at 17.9, 1st)… Having a player of Jokić`s caliber, coming off another MVP-level season, is a significant advantage that can compensate for most, if not all, team weaknesses.

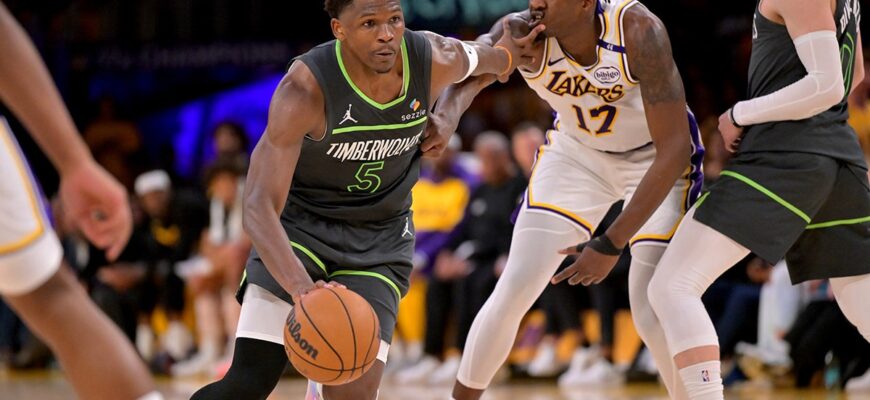
Los Angeles Lakers
Stat category: Team free throw rate (27.1 FTAs per 100 FGA, 1st)
Why it matters: Interestingly, excelling in seemingly positive areas like frequently getting to the free throw line can become a disadvantage in the playoffs. Analysis of postseason data shows that teams heavily reliant on free throws for offense perform well in the regular season due to frequent whistles. However, in the playoffs, where games are often officiated differently and free throw attempts per shot decrease (as seen in the last two postseasons), this strength can become a liability. These Lakers exemplify this trend, as their highest-usage players – Luka Dončić, LeBron James, and Austin Reaves – all draw fouls at an above-average rate, with Dončić and Reaves being among the league`s most adept at getting to the line.
Saving grace? Previous playoff experience (2183.8 minutes per player, weighted by 2024-25 minutes, 2nd)… A consistent lesson from NBA playoffs is the value of prior experience. Only the Boston Celtics` roster boasts more cumulative playoff minutes than the Lakers`.
Moderate Concerns
These vulnerabilities are not necessarily fatal for these seven teams, but they still pose risks, particularly against strong playoff opponents or when officiating isn`t favorable.

Golden State Warriors
Stat category: 2-point percentage (52.8%, 23rd)
Why it matters: While not as severe as Houston`s interior shooting issues, the Warriors` 2-point conversion rate is still a moderate concern. Golden State isn`t a top-tier team at finishing near the basket and was one of the league`s least efficient midrange shooting teams in the regular season. Although midrange shots aren`t a significant part of their offense, better reliability on interior attempts would benefit a team ranked 15th in offensive efficiency. Neither Stephen Curry nor Jimmy Butler III converted two-pointers at or above the league average this season, and none of the Warriors` top nine players by minutes played achieved an average or better 2-point percentage.
Saving grace? Previous playoff experience (1960.6 minutes per player, weighted by 2024-25 minutes, 3rd)… Similar to the Lakers, the Warriors` roster is rich with past postseason experience. The midseason addition of Jimmy Butler, a two-time Finals participant, further boosted this metric.

Milwaukee Bucks
Stat category: Free throw attempt rate (26.8 FTA per 100 FGA, 3rd)
Why it matters: As previously discussed, a high reliance on free throws can become a problem when trips to the line become less frequent in the playoffs. The Bucks are partly responsible for this trend in playoff data, as Giannis Antetokounmpo, who ranked third in free throw rate this season, consistently makes the Bucks one of the most frequent foul-drawing teams. While Antetokounmpo`s free throw percentage has sometimes been a postseason issue, his rate of getting to the line (relative to the league average) also tends to decrease. The same pattern holds for Damian Lillard. Their combined ability to draw fouls was the primary driver of Milwaukee`s high regular-season FTA rate.
Saving grace? WAR of best player (Antetokounmpo at 12.5, 3rd)… Despite potential free throw issues, the 2021 NBA champion remains a dominant force capable of carrying the Bucks deep into the playoffs, an impact that cannot be overlooked.

Detroit Pistons
Stat category: Opponent FT rate (27.6 FTA per 100 FGA, 27th)
Why it matters: We`ve focused on how free-throw-heavy *offenses* struggle when calls tighten, but the opposite side—teams that send *opponents* to the line frequently—also tend to fare worse in reaching the Finals. Why? Playoff games are slower and more reliant on half-court sets, making every possession more critical. Conceding easy points via free throws becomes more costly. Also, teams might have more control over their own fouling rate than their ability to draw fouls on offense. The Pistons sent opponents to the line frequently this season. While rim protection was decent, Isaiah Stewart, Ausar Thompson, and Jalen Duren were among the league`s most frequent foulers, contributing to this vulnerability.
Saving grace? Two-point percentage (55.0%, 16th)… The Pistons earn credit here despite being middle-of-the-pack, due to the statistical weight of 2P% in predicting Finals teams. The same trio (Stewart, Thompson, Duren) mentioned for their fouls also posted solid 2P% numbers this season.

Oklahoma City Thunder
Stat category: Opponent FT rate (27.2 FTA per 100 FGA, 26th)
Why it matters: The Thunder`s most apparent weakness – youth and limited playoff experience – has improved from last year, but they share Detroit`s issue with foul frequency. OKC is one of the most active defensive teams, leading the league in steals per 100 possessions (10.3) and ranking second in blocks per 100 (5.7), even with prolific shot-blocker Chet Holmgren missing significant time. This aggressive defense naturally leads to fouls. However, if a weakness must be found for a team that won 68 games and posted a net rating (+12.8) second only to the 1995-96 Bulls in the post-merger era, it`s this tendency to send opponents to the line.
Saving grace? WAR of best player (Shai Gilgeous-Alexander at 17.8, 2nd)… Regardless of the order, Gilgeous-Alexander and Jokić were clearly the top two players in the league, and SGA is likely the MVP. Players of this caliber significantly increase a team`s chances of reaching the Finals.

Memphis Grizzlies
Stat category: Opponent FT rate (26.7 FTA per 100 FGA, 25th)
Why it matters: Completing the group of foul-prone teams are the Grizzlies, who, like the Thunder, ranked high in block and steal rates, fueling a top-10 defense. This disruption often comes with sending opponents to the free throw line. While players like Zach Edey, Scotty Pippen Jr., and Jaren Jackson Jr. (and Brandon Clarke, though injured) are key to this disruptive style, it fits the profile of teams whose defensive approach might not be fully conducive to a deep playoff run.
Saving grace? Two-point percentage (55.6%, 9th)… Memphis is an effective shooting team inside the arc, with eight of their top 13 players by minutes converting two-pointers at or above the league average rate, and the rest within 5%.

New York Knicks
Stat category: 3-point attempt rate (38.2% of FGA, 28th)
Why it matters: Similar to Denver, the Knicks are proficient from three when they shoot it (36.9%, eighth best), but the 3-pointer isn`t a primary focus in the shot distribution for most key players, with Miles McBride being an exception (57% of his shots from deep). Many Knicks players are centered around interior scoring or finishing, such as Karl-Anthony Towns` post-up game or Jalen Brunson`s drives. However, opponents have shown the ability to adapt and counter New York`s core offensive strategies, which can be particularly challenging in a seven-game series.
Saving grace? Two-point percentage (55.8%, 8th)… The counterpoint to their low 3-point volume is that the Knicks are efficient inside the arc, converting two-pointers at the league`s fourth-highest rate per 100 possessions. Josh Hart, for instance, made nearly 62% of his two-pointers, an impressive figure for a versatile forward.

LA Clippers
Stat category: 3-point attempt rate (38.7% of FGA, 25th)
Why it matters: It might be surprising that a team featuring James Harden as a leading scorer is among the league`s least reliant on 3-pointers. The Clippers` shot distribution among key rotation players varies significantly: some shoot threes more often than average (Harden, Norman Powell, Kris Dunn), others much less frequently (Kawhi Leonard, Ivica Zubac, Derrick Jones Jr.), with only Nicolas Batum taking a significantly higher proportion of threes (85% of his shots). While the Clippers might be capable of increasing their 3-point volume if needed, it`s an area to watch.
Saving grace? Previous playoff experience (1820.7 minutes per player, weighted by 2024-25 minutes, 4th)… This experience is heavily influenced by Harden and Leonard, but Batum and Powell also contribute valuable postseason time.
Minor Issues
This group of five teams has less severe problems that could potentially surface in a close series or specific matchup, but they are unlikely to be defining weaknesses. These teams` minor issues don`t necessarily require a `saving grace` to offset them.

Miami Heat
Stat category: 2-point percentage (53.8%, 20th)
Why it matters: Several overarching factors make a deep Finals run unlikely for the Heat, chief among them drawing the 64-win Cleveland Cavaliers as the first 10-seed to emerge from the play-in tournament. However, their relatively weaker 2-point conversion rate is another factor. This is perhaps symbolized by Bam Adebayo`s unusual arc: after shooting a strong 56.5% inside the arc in his first five seasons (8% better than average), he`s converted just 53.1% since (3% worse than average).

Indiana Pacers
Stat category: 3-point attempt rate (40.0% of FGA, 21st)
Why it matters: The Pacers are strongly associated with Tyrese Haliburton, a high-volume 3-point shooter among lead guards, yet as a team, they aren`t heavily reliant on outside shooting volume. Beyond Haliburton, none of their top seven players by minutes took a significantly above-average share of their shots from three, while Pascal Siakam, Bennedict Mathurin, Andrew Nembhard, and T.J. McConnell were well below the league average. Despite a lower 3-point rate, Indiana ranked ninth in offensive rating, so this issue might not be critical, but they are potentially easier to defend from the perimeter compared to other teams at their level of contention.

Boston Celtics
Stat category: Opponent assist rate (opponents assist on 59.6% of made FGs, 29th)
Why it matters: The fact that a somewhat peripheral category represents the Celtics` biggest statistical `red flag` in predicting Finals appearances speaks volumes about their overall strength. Boston was above the league average in most key metrics this season, especially those significant in the playoffs, requiring a search for less obvious weaknesses. However, it`s curious that teams allowing fewer assists (often indicating effective disruption of ball movement, which Boston excels at with their perimeter defenders) have historically performed worse in the playoffs. The exact reason for this trend is unclear, but it stands out in the data.

Minnesota Timberwolves
Stat category: Free throw attempt rate (24.9 FTA per 100 FGA, 10th)
Why it matters: Led by Anthony Edwards, Julius Randle, and Rudy Gobert, the Timberwolves were effective at drawing fouls this season despite ranking 25th in 2-point attempts per 100 possessions (2-pointers generally lead to more fouls than 3-pointers). This does create a potential vulnerability if they don`t receive the same frequency of calls in the playoffs. However, it`s worth noting that each of their top five scorers last season maintained or exceeded their regular-season FTA rate during their Western Conference Finals loss to Dallas. So, officiating wasn`t the primary issue in that instance.

Cleveland Cavaliers
Stat category: Playoff experience (657.6 minutes per player, weighted by 2024-25 minutes, 15th)
Why it matters: Having prior experience on the NBA`s biggest stage is important in the playoffs. The Cavaliers do have players with significant past postseason minutes, notably Donovan Mitchell (2,032 minutes) and Max Strus (1,611) among their regular rotation. (Tristan Thompson`s extensive 2,616 minutes might be less relevant if he sees limited playing time). While their roster`s average of around 658 weighted minutes is higher than the extremely low number seen from Oklahoma City last season, it`s still on the lower side historically. Teams averaging between 500 and 1,000 previous postseason minutes tend to win slightly fewer playoff games than their regular-season performance would suggest. This makes it a minor concern for Cleveland, but a concern nonetheless.